Tuesday 27 August 2013

Emerging Markets Continue to be Hammered

Catching the falling knife is a very apt term right now for those in the emerging markets.

Southeast Asia especially has taken it hard, Indonesia especially.  Check out the charts and tell me those don't look ugly.  Are they likely oversold on a relative basis?  Very much so.  Will they undergo reversal anytime soon?  Harder to say.


Tuesday 20 August 2013

Market Valuations vs the Past

Interesting quote from Morningstar's article 10 High Conviction Purchases via Pat English of FMI Large Cap (FMIHX)
Today it is very difficult to find stocks that have defendable business franchises and strong balance sheets, and that trade at attractive valuations. In the late 1990s, even though stock market valuations were at an extreme, most of the excess was confined to a few sectors. It was not difficult to build a diversified portfolio of high-quality businesses at reasonable prices. Similarly, in the middle of the last decade, it was relatively easy to avoid housing-related stocks or complex financial enterprises that were heavily involved in derivative alchemy. Today, this is not the case. There is widespread overvaluation. Many more stocks are overvalued today than in the late 1990s; it's just that the mathematics of market weighted indices doesn't show this. In the late 1990s, highly valued mega market cap names like AOL, Dell, and Cisco made the markets look more expensive than the median multiple would indicate. Today, the median multiple is higher than what it was in 1999, a period that is widely regarded as the most expensive ever.


That is certainly true for me as its been extremely difficult to find many undervalued stocks in the US.  Overseas its a bit easier but at the moment, it's still a falling knife effect.

What did Morningstar list as their top 10?

Top 10 High-Conviction Purchases made by Our Ultimate Stock-Pickers
 
Star Rating
Size of Moat
Current Price (USD)
Price/ Fair Value
Fair Value Uncertainty
Market Cap ($ Mil.)
# Funds Buying
Nat Oilwell Varco NOV
4
Wide
72.73
0.86
Medium
30,718
3
GM GM
4
None
34.38
0.66
High
47,353
3
Wells Fargo WFC
3
Narrow
42.75
0.93
Medium
225,726
3
Devon DVN
4
Narrow
57.38
0.66
High
23,039
3
Apple APPL
4
Narrow
502.33
0.84
High
460,417
2
Oracle ORCL
4
Wide
32.41
0.85
Medium
148,617
2
CH Robinson CHRW
4
Wide
56.13
0.81
Medium
8,984
2
Intel INTC
4
Wide
21.92
0.88
Medium
108,611
2
Accenture ACN
3
Narrow
71.65
0.98
Medium
48,498
2
Apache APA
4
Narrow
78.99
0.72
Medium
30,270
2


Interestingly for me, I noticed and bought into several of these recently - namely WFC/AAPL/INTC.  For GM, I went with F instead.  I did look at a few of these others though.  There is definitely value hidden in some of these.

Wednesday 14 August 2013

blajkd

blajkd

ETF YTD Performance Update


Just got back from vacation in the Philippines on Tuesday and reminded me to check in where most country based ETFs are.  Philippines (EPHE) had a crazy beginning of the year, up 20%+ by May but only to drop during the QE Taper scare in May/June.  It hasn't quite yet fully recovered with a YTD return of only 3%.


It does look interesting from a technical perspective.  Below is from BespokeInvest.com and highlights where most ETF's are.

Interestingly, everything to do with the US is up to the tune of 19-25% with gains across almost all sectors with healthcare and consumer discretionary leading.  However, internationals are still trailing as well as commodities though they've bounced back a bit since June.

Monday 5 August 2013

Returns by Asset Allocation

Following my last post about the world markets doing poorly, just found this chart from JP Morgan courtesy of Ritholtz.com:

Note that this is as of end of June so its a tad out of date.  But its interesting primarily to see a few things:

1 - Asset allocation (mixture of various assets) vastly underperformed the US stock market (4.5% vs 13.8%)

2 - Intl stocks were a big loser along with commodities (3 yrs running now), emerging markets (near bottom for 2 out of last 3 yrs) and bonds (below avg for 2 yrs runing)

Markets up 20% YTD

The S&P 500 is now up over 20% YTD by various measures...that's a pretty big jump and we're less than 3/4th of the way thru the year still.

What are the chances of it continuing to go up?  Very unlikely but...I've been saying that for a while and been wrong.  So who knows...  Wonder if all the bears have given up and piled back in yet.  I haven't seen many sentiment numbers lately so that would be a curious data point to see.

One chart from Bespoke Invest shows not that much change in market poll results though markedly higher than earlier this year:


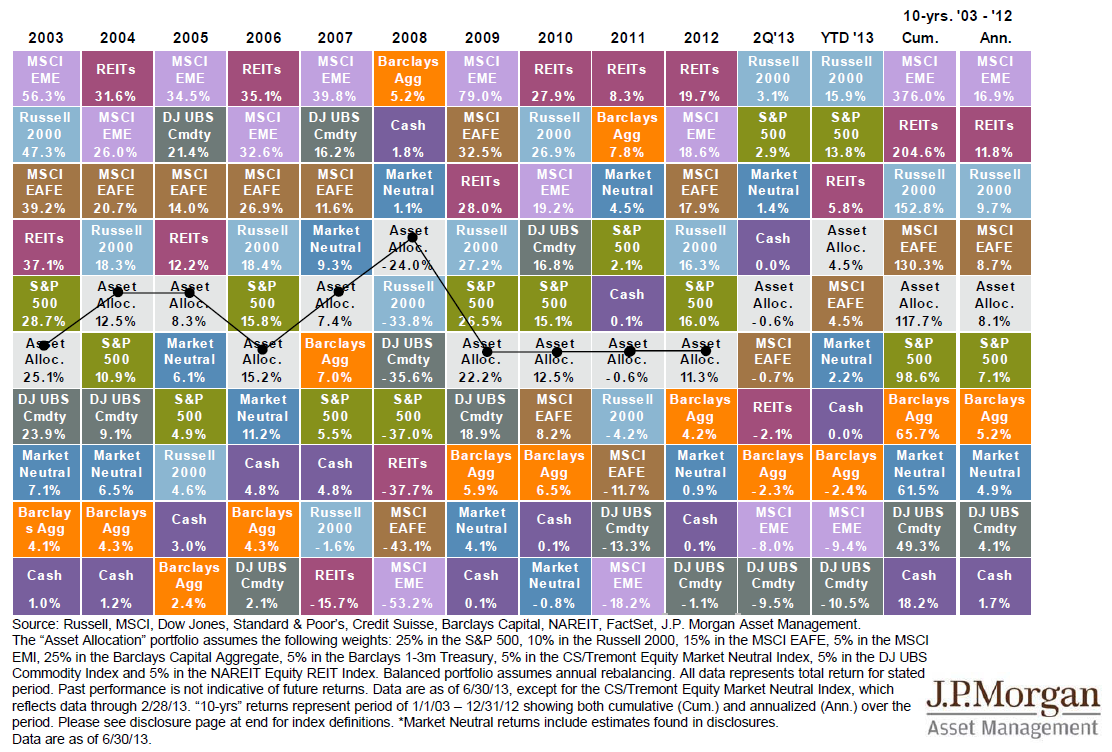
While much can be said of the US results, the rest of the world however hasn't fared quite as well.
VEU - the Vanguard ETF for world stocks excluding US is only up 4.7% YTD

VWO - Vanguard Emerging Market ETF is down an enormous -9% YTD.

Looks like the US stocks are eating everyone else's breakfast and lunch and dinner...

Thursday 1 August 2013

Leveraged ETF Correlations

This got edited out of my MarketWatch article but here's the chart showing how well SSO (2x) and SDS (2x inverse) ETF compares vs the S&P 500 ETF SPY


As you can see, it tracks fairly well on a DAILY return basis.  SSO was at 1.97x and SDS was at -1.99x.  Pretty impressive really.