Wednesday 29 May 2013

Utilities Falling off its Cliff

As I mentioned before, this rally has been unusual in how strong the defensives such as the Utilities sector has been.  Normally they underperform going into the rally, not leading it.

Likely the search for reliable safe yield has been pushing demand for them.  However, with the suggestion that QE may finally start tapering off, as well as the market just being plain overbought, looks like the Utilities are starting to come off its highs, and in a big way.

As seen below, XLU has just absolutely plummeted in the last 5 days especially, has moved past its 50 DMA and is close to contesting its 200 DMA.  This really isn't that surprising as by many metrics, the defensives were incredibly overvalued.  Their current yield before the drop was a very uninspiring 3.5%, very low considering you can get yields of 3.3% from DVY and 5.8% from PFF.


In general however, the market has definitely taken a short breather this week, all due to the Fed announcements.  Is this the start of a down cycle or just another pause?  Interestingly, there's been a rocky spot in the rally every month and a half, last seem in mid may and in late Feb before that.  Those only lasted 1 week before the market continued its climb.  We're halfway thru that same cycle, so it'll be an interesting indicator of the sustainability of this market.  My feeling is that market is overdue for a consolidation at minimum and likely a correction.  However, I been expecting one for a couple months now so...take that as you will.  I'll be curious to see what sentiment data is like, haven't seen any charts on that lately.


Friday 24 May 2013

Thursday 23 May 2013

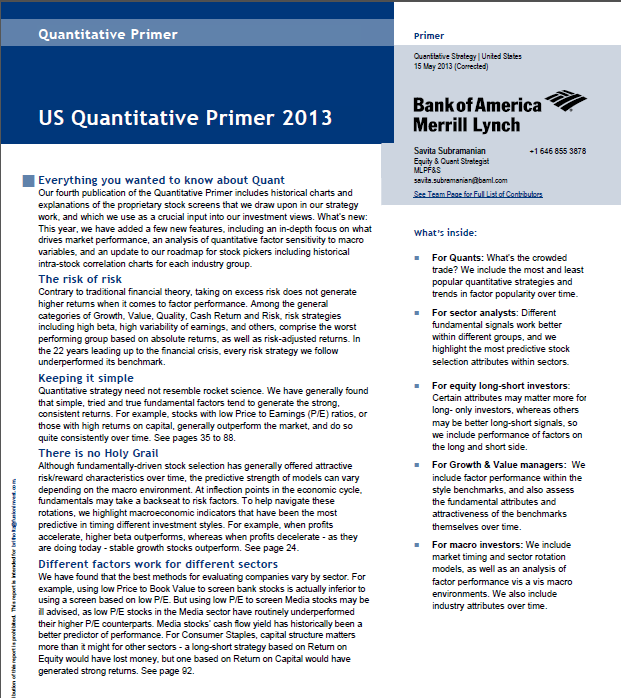
Merrill Lynch Quantitative Handbook

Been busy again lately (will hear more of what's happening in a month or so) but I found this interesting handbook from The Big Picture which complements the previous post about Merrill Lynch's Technical Analysis handbook.

This one is from Merrill Lynch and is titled US Quantitative Primer for 2013, it explains the stock screens used in their strategies.  Its chocked full of various data and charts.

Access it here (Edit: Got notices this link is not working, try this one: Try this one)

US QUant

Sunday 19 May 2013

Tech & Cyclicals Continue to Outperform

In my most recent article on MarketWatch, I highlighted that in the last few weeks, the cyclicals such as tech/industrials have started to outperform the non-cyclicals which have dominated this rally for the majority of the time frame.

Well, another week has passed and the trend continues.  Below is the results from this week.

The cyclicals outpaced the defensive non-cyclicals by about 0.6%.  Not bad.  If you had just continued to index, you would've also still done well however.

The best sector last week however was financials.  XLF was up 3.6%.  Insane.

Sector:
Gain for the week
Industrials (XLI)
2.27%
Tech (XLK)
2.19%
Utilities (XLU)
1.23%
Cons. Stpl (XLP)
1.90%
S&P 500 (SPY)
2.16%

Wednesday 15 May 2013

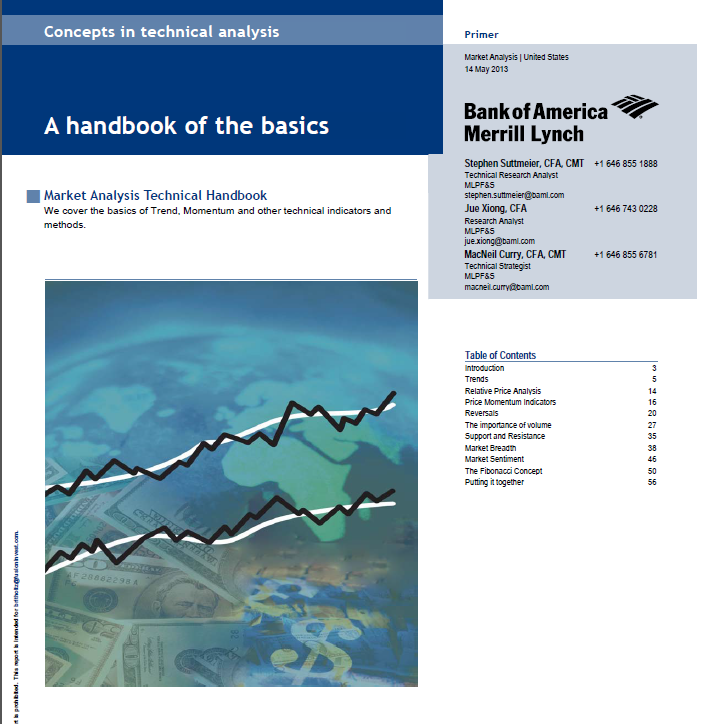
Technical Analysis Handbook

The Big Picture pointed out a little handbook from Merrill Lynch detailing their guide to technical analysis.  A hand read.

Download it here

MER TA