Sunday 29 September 2013

Gini Coefficient & Singapore

Did some reading the other today about income inequality and its general propensity as an indicator of social unrest.  I found a neat table from CIA World Factbook listing where countries rank.

Very interesting to note that the top developed countries (is South Africa considered developed? Iffy in my opinion) on the list would be:

1 - Hong Kong (53.7)
2 - Singapore (47.8)
3 - USA (45.0)
4 - South Korea (41.9)
5 - UK (40.0)

Its a bit sad that these countries (esp #1 & 2) are on the same level as places like Guatemala, Zimbabwe, Madagascar, and China.  I'm not exactly a socialist or communist but large distributions of wealth and poverty is never a good thing.  Having traveled to many of the countries here, its really appalling to leave the nice snazzy hotel and see tarps/tents on the road median just in front with families huddled together beneath it.

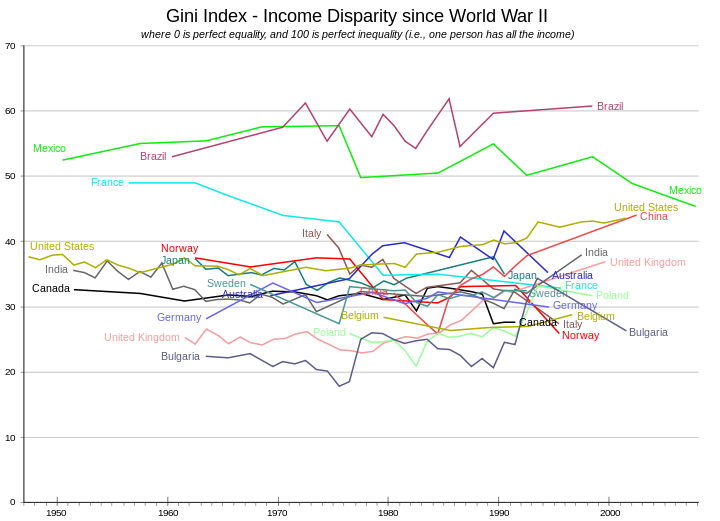
For Hong Kong & Singapore, I suspect the inequality may be worse than listed because the coefficient doesn't take into account several factors like housing costs (its insane to buy a decent home in Singapore & HK without being rich).  For the USA, I'm surprised its so high considering there is still a decently sized middle class there (though shrinking every year).  Below, I also show historical Gini coefficient, notice how many countries are increasing in income inequality over time.


RANK
COUNTRYDISTRIBUTION OF FAMILY INCOME - GINI INDEXDATE OF INFORMATION
1Lesotho
63.2
1995
2South Africa
63.1
2005
3Botswana
63.0
1993
4Sierra Leone
62.9
1989
5Central African Republic
61.3
1993
6Namibia
59.7
2010
7Haiti
59.2
2001
8Colombia
58.5
2011
9Honduras
57.7
2007
10Guatemala
55.1
2007
11Hong Kong
53.7
2011
12Thailand
53.6
2009
13Paraguay
53.2
2009
14Bolivia
53.0
2010
15Chile
52.1
2009
16Panama
51.9
2010 est.
17Brazil
51.9
2012
18Papua New Guinea
50.9
1996
19Zambia
50.8
2004
20Swaziland
50.4
2001
21Costa Rica
50.3
2009
22Gambia, The
50.2
1998
23Zimbabwe
50.1
2006
24Sri Lanka
49.0
2010
25Mexico
48.3
2008
26Singapore
47.8
2012
27Ecuador
47.7
December 2012
28Madagascar
47.5
2001
29China
47.4
2012
30Dominican Republic
47.2
2010 est.
31El Salvador
46.9
2007
32Rwanda
46.8
2000
33Malaysia
46.2
2009
34Peru
46.0
2010
35Georgia
46.0
2011
36Argentina
45.8
2009
37Mozambique
45.6
2008
38Jamaica
45.5
2004
39Bulgaria
45.3
2007
40Uruguay
45.3
2010
41United States
45.0
2007
42Philippines
44.8
2009
43Cameroon
44.6
2001
44Guyana
44.6
2007
45Iran
44.5
2006
46Uganda
44.3
2009
47Nigeria
43.7
2003
48Macedonia
43.2
2009
49Kenya
42.5
2008 est.
50Burundi
42.4
1998


The change in Gini indices has differed across countries. Some countries have change little over time, such as Belgium, Canada, Germany, Japan, and Sweden. Brazil has oscillated around a steady value. France, Italy, Mexico, and Norway have shown marked declines. China and the US have increased steadily. Australia grew to moderate levels before dropping. India sank before rising again. The UK and Poland stayed at very low levels before rising. Bulgaria had an increase of fits-and-starts. .svg alt text

No comments:

Post a Comment